»»» ![]() shows where students could discuss/think about a topic/concept.
shows where students could discuss/think about a topic/concept. ![]() shows where an activity is introduced. »»»
shows where an activity is introduced. »»»
IceTop is a cosmic-ray detector. It is an array of instruments that observe the air showers of secondary particles created by cosmic rays when they interact with the Earth’s atmosphere. This data allows us to study the composition of cosmic rays, the distribution of the cosmic-ray arrival directions, and the high-energy spectrum of cosmic rays.
Cosmic rays include particles such as electrons, protons, and heavier nuclei. Their sources are not yet known, but we expect them to be both galactic and extragalactic. The energy spectrum of cosmic rays, which is how the rate changes with increasing energy, has been measured by many detectors, including IceTop. Extragalactic sources are expected to be more abundant as energy increases and to be the only ones responsible for very high energy cosmic rays.
Precise measurements of the cosmic-ray energy spectrum can help us learn more about the transition from galactic to extragalactic sources and, thus, about the properties of the cosmic-ray sources.
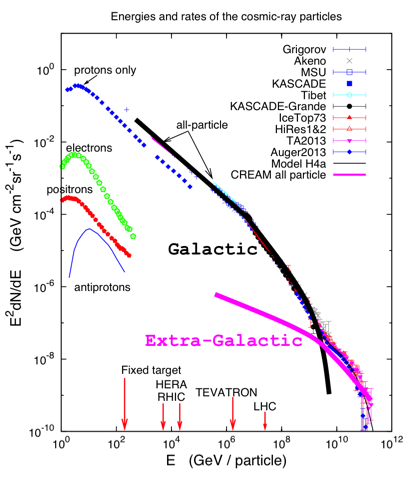
IceTop detects cosmic rays in the energy range from about 100 TeV to 1 EeV, which happens to be the region of the transition from galactic to extragalactic cosmic rays.
![]() However, the cosmic-ray rate measured by IceTop cannot be directly compared to other experiments. Can you think of a quantity that could be used to compare results among several detectors?
However, the cosmic-ray rate measured by IceTop cannot be directly compared to other experiments. Can you think of a quantity that could be used to compare results among several detectors?
Hint: The number of cosmic-ray events observed by a detector depends on its geometry and location.
Physicists use the cosmic-ray flux, i.e., the rate at which cosmic rays arrive at Earth for a given area and a given angle, to compare measurements from different detectors.
What does IceTop measure?
Let’s see what IceTop sees and can measure.
Here we have two simulated cosmic ray showers.
Source: https://web.iap.kit.edu/corsika/movies/Movies.htm
In both cases, it’s a 100 TeV proton. On the left, it’s a vertical shower. On the right, the shower axis is 30 degrees off.
As you can see in the movies, for each cosmic-ray air shower there can be a million or more particles hitting the ground. IceTop will only detect some.
![]() Can you identify a few properties of the shower that allow you to characterize it?
Can you identify a few properties of the shower that allow you to characterize it?
Now look at a cosmic-ray event in IceTop.
Several IceTop stations light up for each cosmic-ray event. Each one records the passage of one or more particles from the cosmic-ray induced air shower. Red colors indicate the first stations to detect particles, while green/yellow are later detections. The size of the colored bubble around each station scales with the energy measured at that specific station.
![]() Can we find out the direction of the incoming cosmic ray by looking at the pattern of light in IceTop? And what about the location of the shower core?
Can we find out the direction of the incoming cosmic ray by looking at the pattern of light in IceTop? And what about the location of the shower core?
Remember: IceTop detects electrons, photons, muons, and charged hadrons in the shower thanks to the blue light, called Cherenkov light, that they produce when crossing the detector. See this Cherenkov light in a nuclear reactor here.
![]() Can we learn about the energy of the incoming cosmic ray from the measurement of the energy in the IceTop array?
Can we learn about the energy of the incoming cosmic ray from the measurement of the energy in the IceTop array?
Hint: Physicists have been studying cosmic-ray air showers for a long time. We know how to simulate what they look like and what signal we should expect in IceTop. We have learned that the shower scales with energy, i.e., it’s a good proxy for the energy of the original cosmic ray.
![]() See some events in IceTop here. Some of them are real events, and some are just simulations. Can you guess which one is which? As you will see, real and simulated events are indistinguishable.
See some events in IceTop here. Some of them are real events, and some are just simulations. Can you guess which one is which? As you will see, real and simulated events are indistinguishable.
![]() Let’s look again at the same events but this time try to measure the shower. Using the different displays (see the image below), try to locate the core of the shower (right display) and fit it to its lateral distribution (left display). You can also change the direction of the shower by moving the zenith and azimuth angles. Save the results once you have done it for the full set.
Let’s look again at the same events but this time try to measure the shower. Using the different displays (see the image below), try to locate the core of the shower (right display) and fit it to its lateral distribution (left display). You can also change the direction of the shower by moving the zenith and azimuth angles. Save the results once you have done it for the full set.
Hint: Remember that the shower front should be flat. The dashed line on the top-right display is the projection of the shower front, i.e., it’s orthogonal to the shower axis.
Energy calibration and the cosmic-ray flux energy spectrum
![]() Using your results, we will first calibrate our detector. To do that, use the simulated events in your table of results (those are the ones for which you know their energy, i.e., E>0).
Using your results, we will first calibrate our detector. To do that, use the simulated events in your table of results (those are the ones for which you know their energy, i.e., E>0).
Hint: Each event, whether data or simulated, also has a weight in your table of results. This is because your set of events has been pre-filtered. IceTop sees thousands of cosmic rays per day, and there is not enough time to look at all of them. The events that you have been exploring are events that represent the rate for given energy range. The weight tells you how many events in this energy range were found in the real/simulated total sample, which was one day of IceCube data. The dependence between the rate and the energy is a power law. Use logarithmic scales to obtain a simple calibration curve.
![]() Now you can use this calibration curve to estimate the energy of the real events and obtain the cosmic-ray flux energy spectrum with IceTop.
Now you can use this calibration curve to estimate the energy of the real events and obtain the cosmic-ray flux energy spectrum with IceTop.
Hint: Remember that we need to normalize the rate by the exposure of our detector. If you use all the events of one color, the exposure is 1/6 day of IceTop data = 8.186 109 m2 sr s. And do not forget to divide by the energy interval covered in each bin.
If you want to compare the results with a real paper by the IceCube Collaboration, you will get a better agreement if you use all six sets of events on the IceTop online tool.
Congratulations! You were able to reproduce a particular research finding of the IceCube Collaboration, published in Physical Review D in August 2013. You can read the paper here.
Further information:
Read the news about this analysis on the IceCube website.